
UpScore for ServiceTitan
Your Business Is Leaving Money on the Table. See Exactly Where.
UpScore turns your ServiceTitan data into a single Monthly Revenue Progress Report that shows where your biggest revenue opportunities are, what they could be worth, and what needs to improve to pursue them.
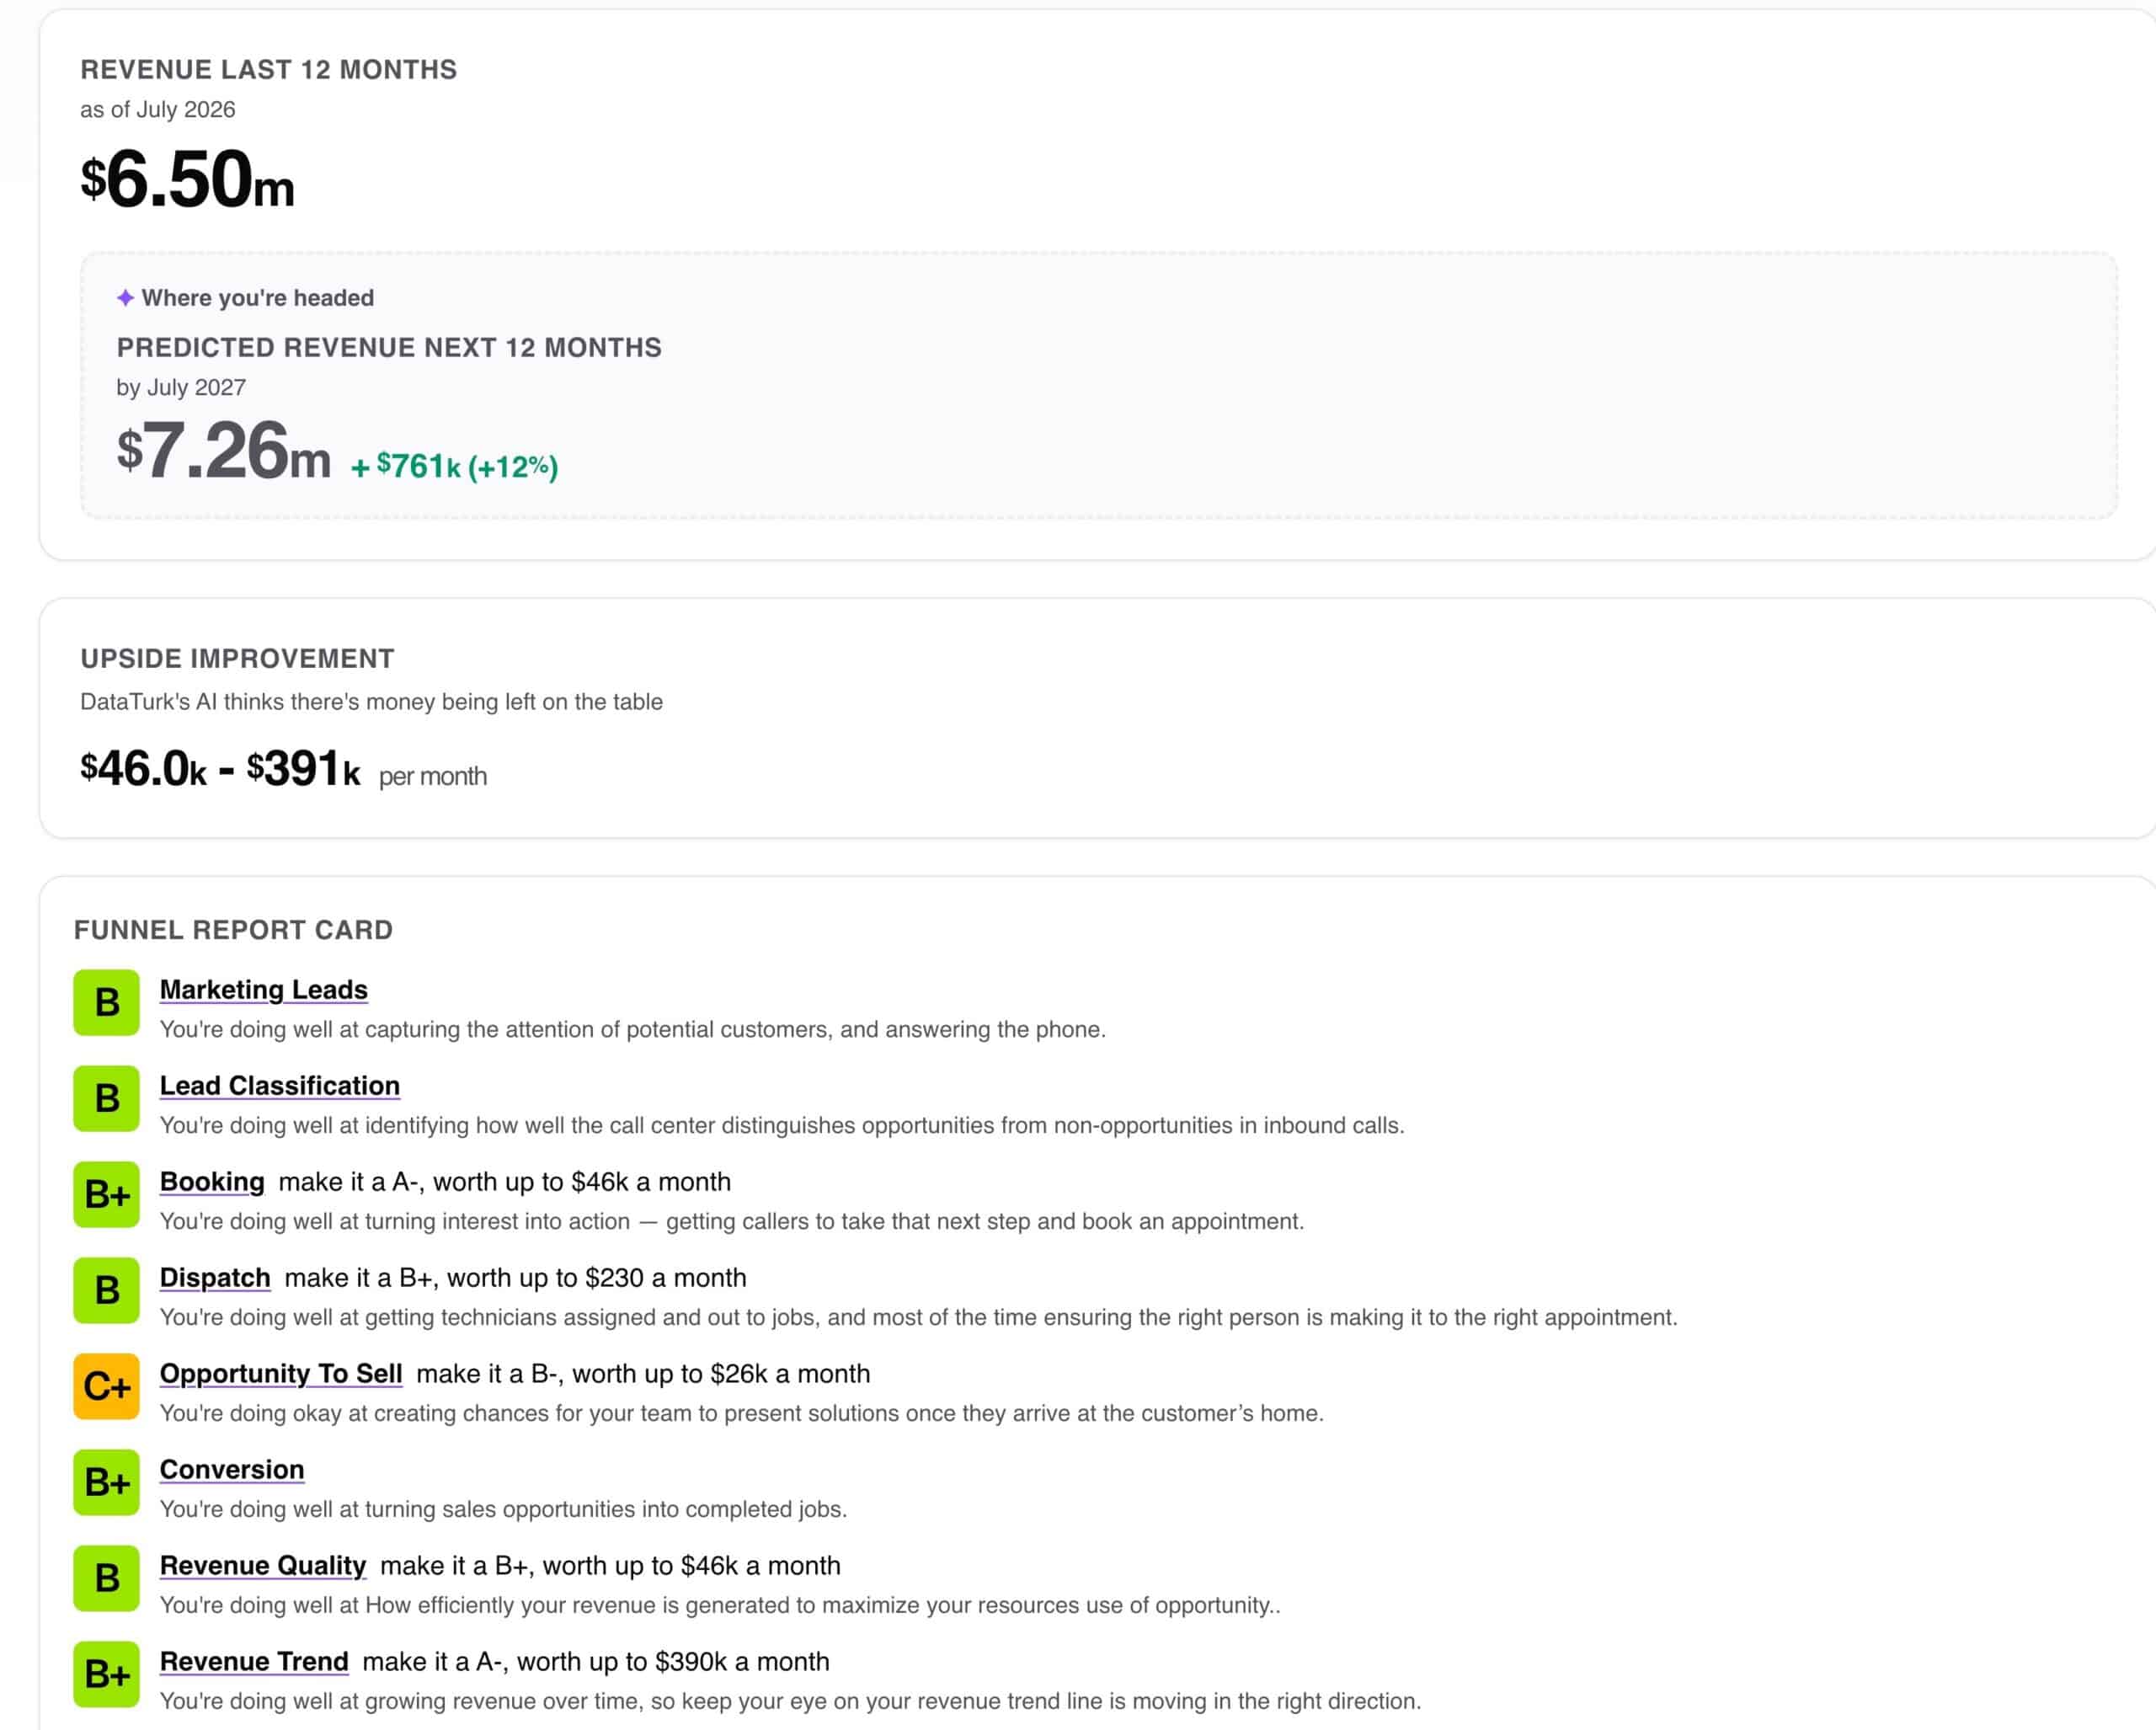
8 Revenue-Process Grades•
Revenue Opportunities•
How to Improve
Revenue Tells You What Happened. UpScore Shows You Where to Look Next.
You probably know whether revenue went up or down. The harder question is why, where the biggest opportunity is, and what needs to change to capture more of it.
UpScore looks across your revenue operations process using the same measurements each month. It shows you where performance stands, where there’s room to move up, and what improving specific areas could be worth.
Start With Three Critical Numbers
Open UpScore and you see the business from three angles.
Trailing 12-month revenue
Predicted revenue for the next 12 months
Estimated monthly upside improvement
Now you can see where revenue has been, where it’s headed, and how much upside may still be available.
See the Whole Revenue Process, Not Just the Outcome
Revenue is the result. UpScore helps you see what happened before it by grading eight areas of your revenue process.
Marketing Leads. Lead Classification. Booking. Dispatch. Opportunity to Sell. Conversion. Revenue Quality. Revenue Trend.
One view shows where you’re doing well and where there’s room to improve.
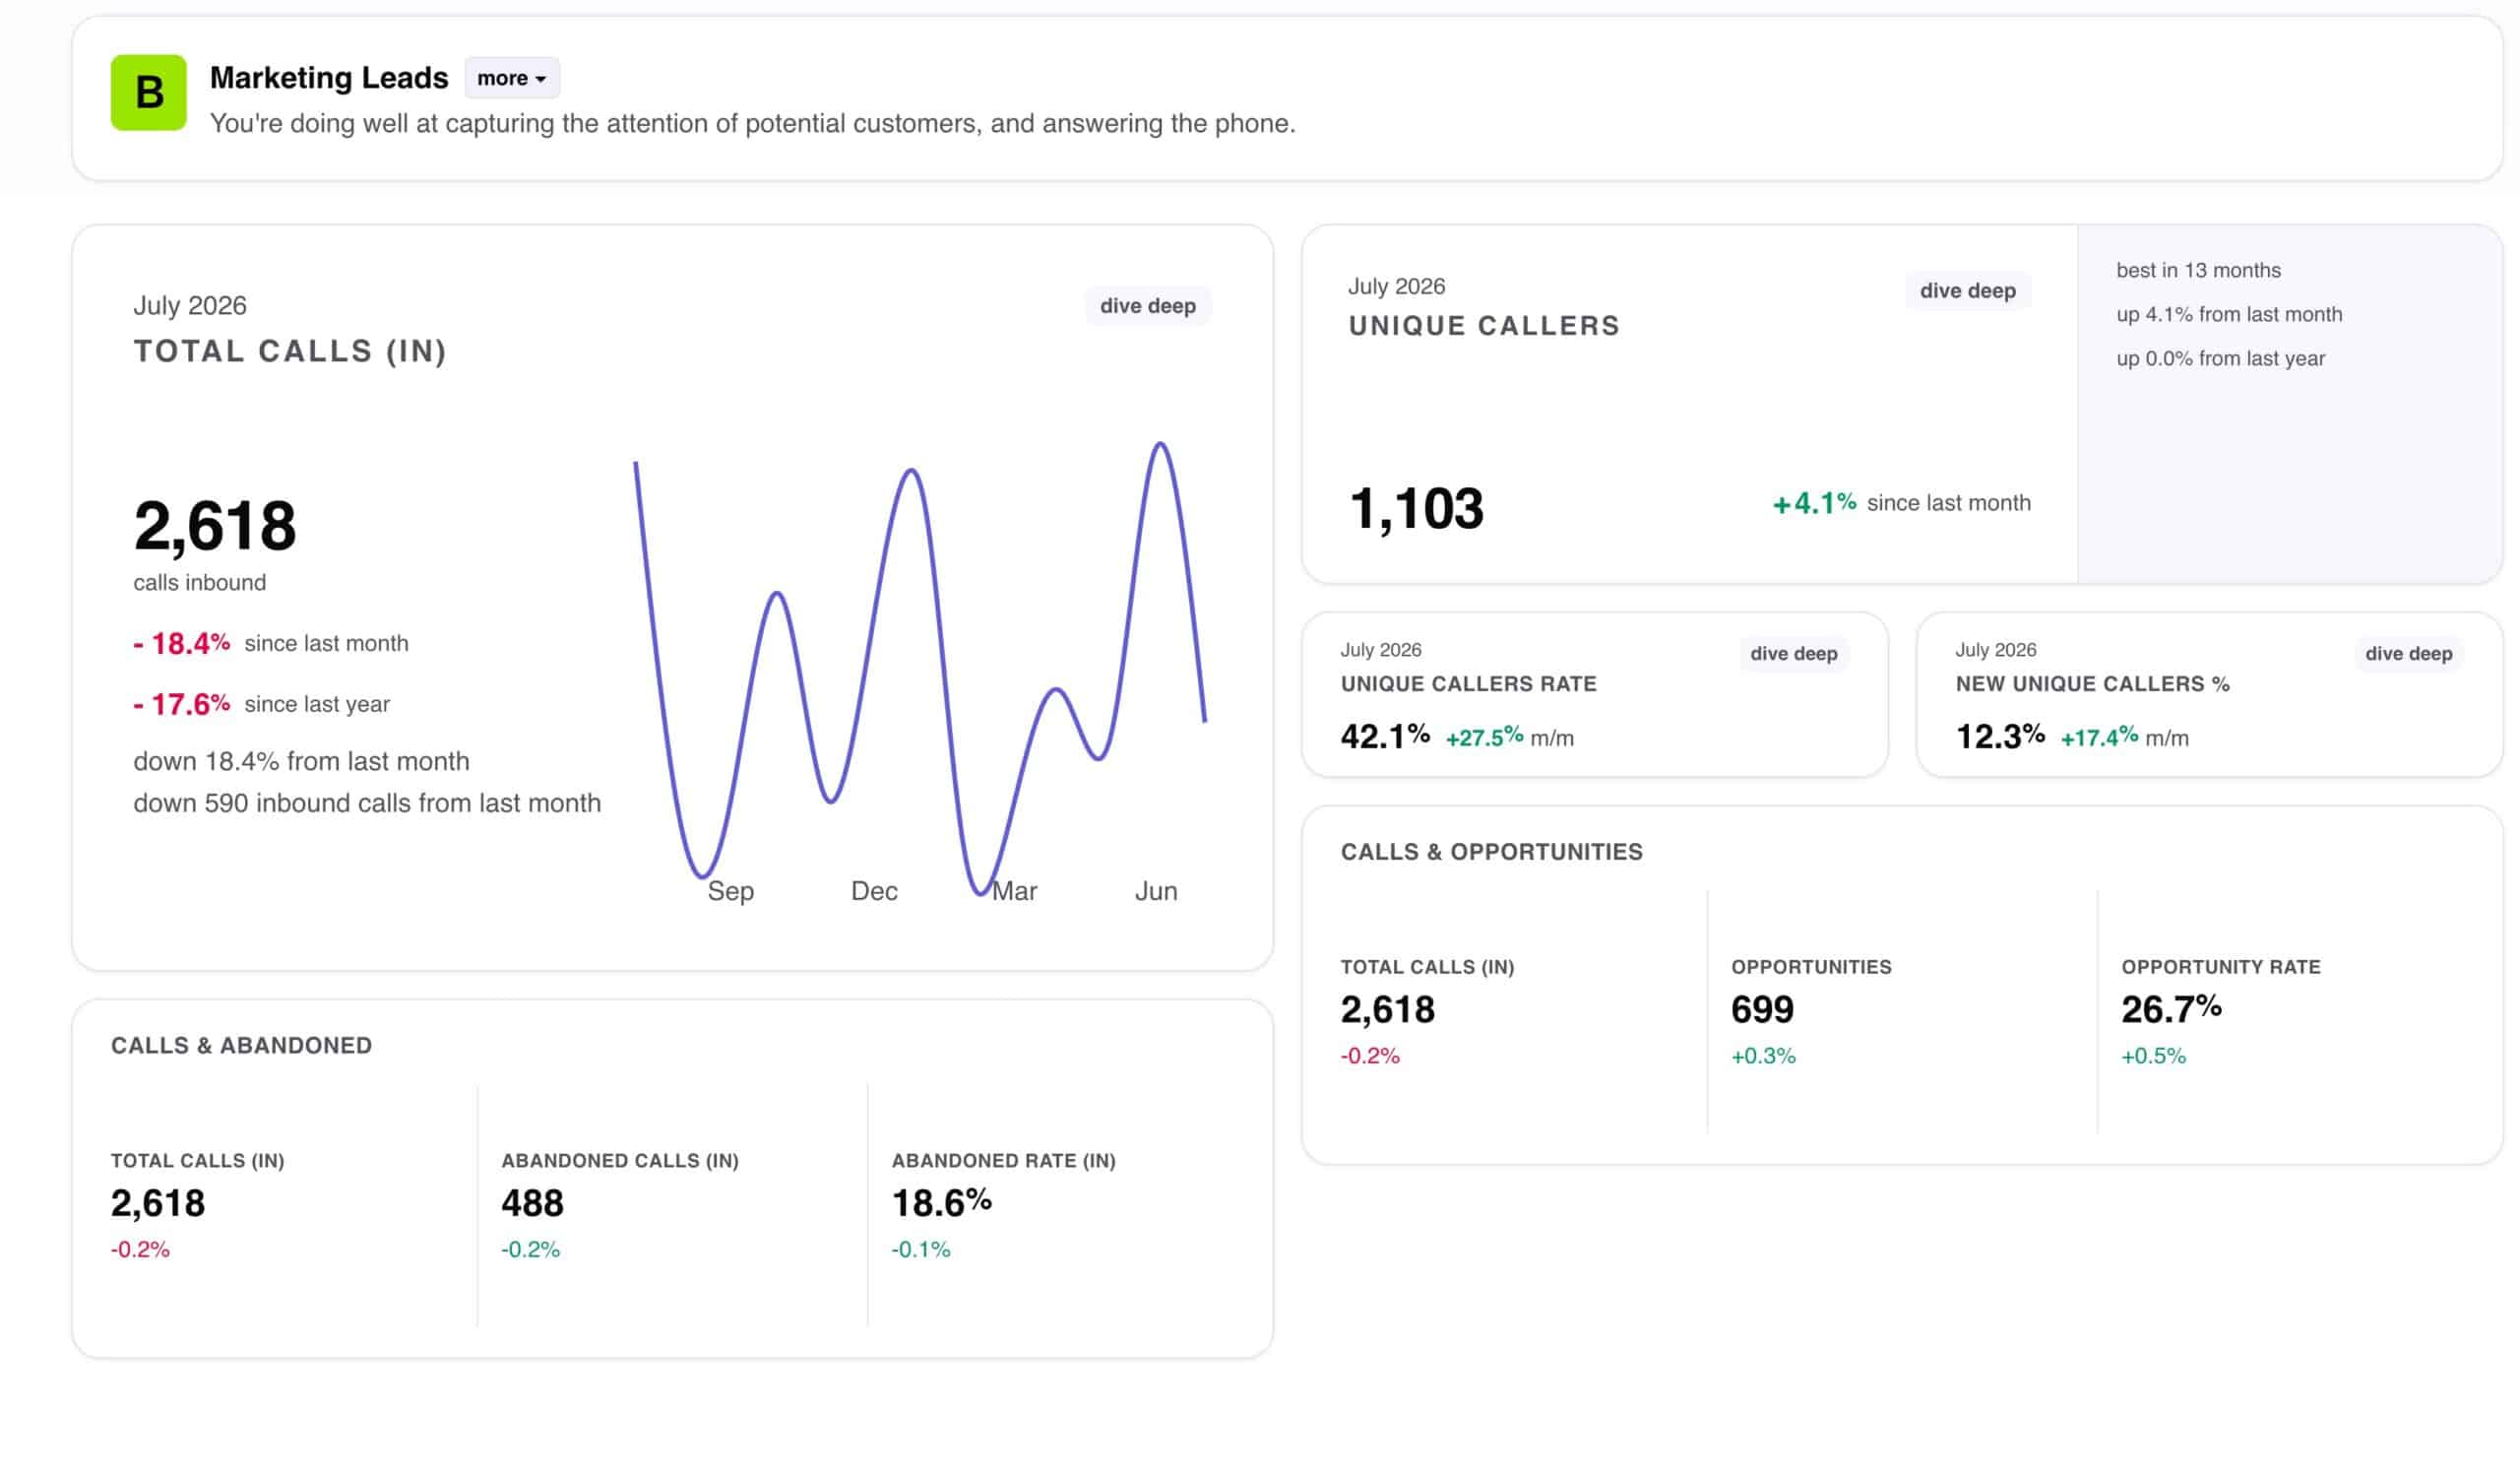
The Lowest Grade Isn’t Always the Biggest Opportunity.
A C may look worse than a B. That doesn’t mean improving the C is worth more money.
UpScore estimates what moving individual areas to the next target grade could be worth. So instead of choosing what to work on based on grade alone, you can compare estimated revenue opportunities.
The grade shows you where you stand. The dollar opportunity helps you decide where to look first.
See What It Could Take to Move Up
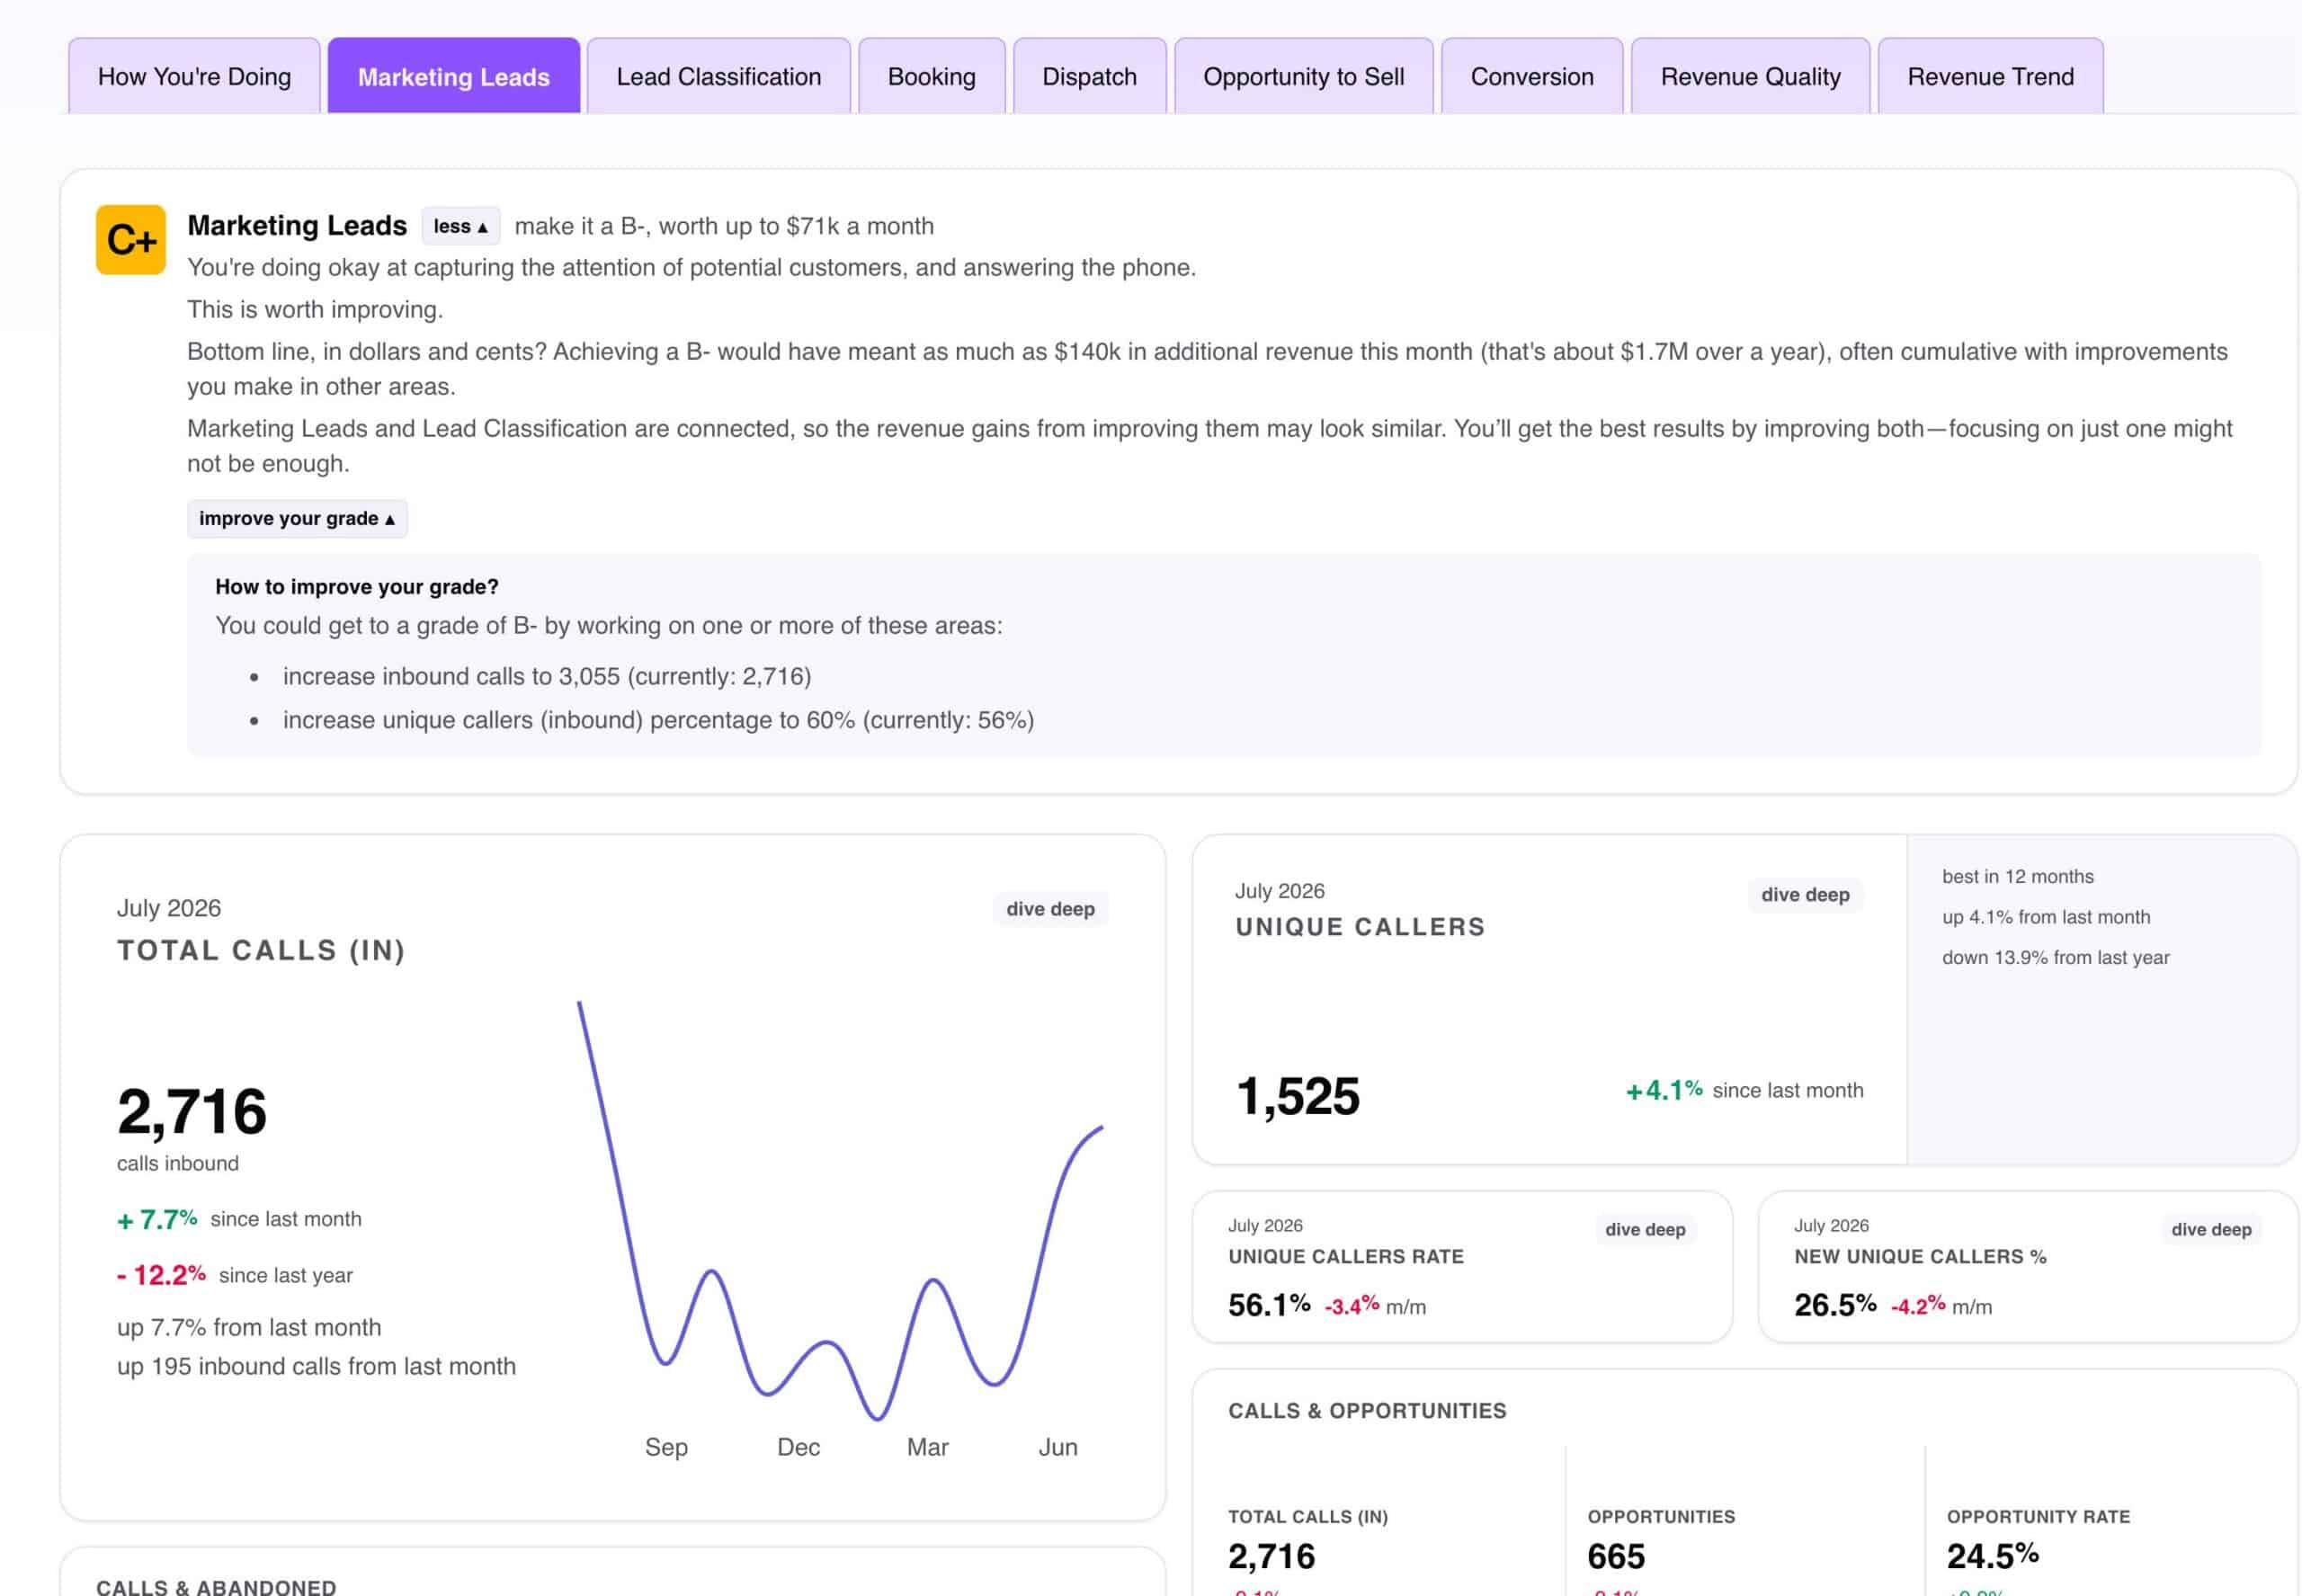
Once you find an area worth looking at, open it.
UpScore shows your current grade, the next grade to work toward, what reaching it could be worth, and which numbers may need to improve to get there.
Now a C+ isn’t just a score. You can see what moving up could be worth and where to start.
Then Dive Into the Numbers
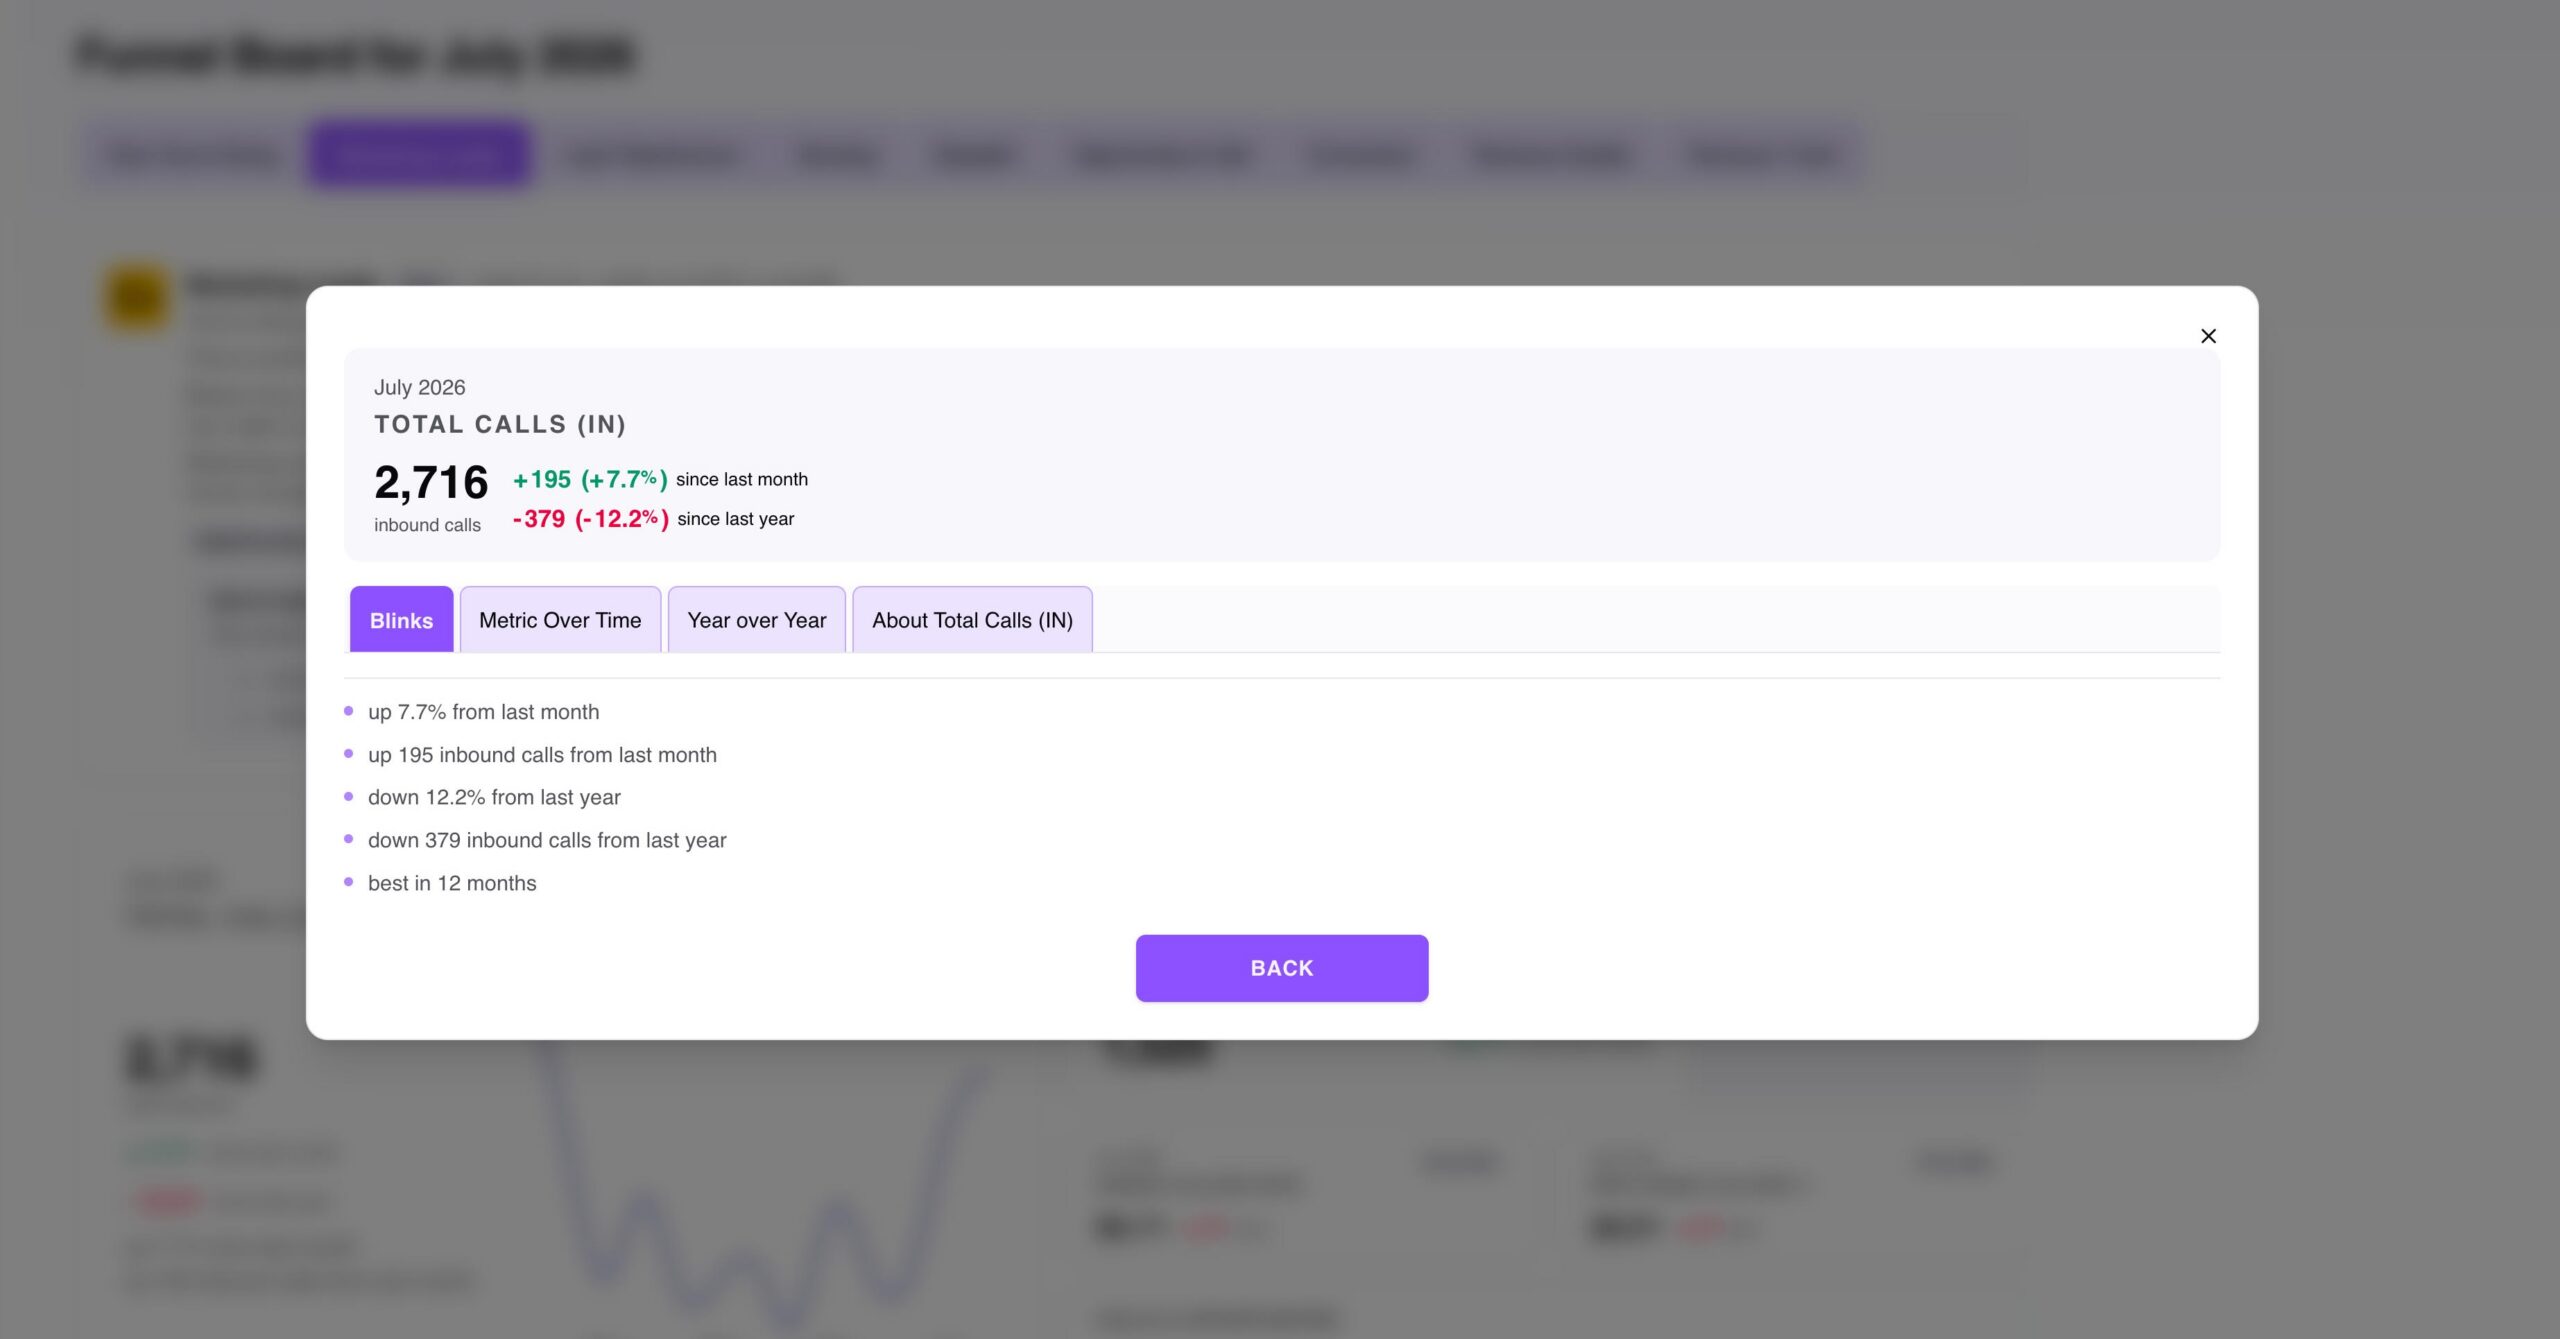
Want to understand one of those numbers? Open the metric and go deeper.
See what changed from last month, how it compares with last year, how it has moved over time, and what the metric actually measures.
You can go from the business result to the opportunity, then all the way down to the numbers behind it.
Why Not Just Ask AI Directly?
You can. But AI usually starts with the question you ask. If revenue is down, you might ask why. AI could tell you your average ticket dropped. That may be right, while a bigger opportunity lies elsewhere in the business.
AI can also answer without knowing exactly how your company defines a booking, sales opportunity, sold job, or completed revenue. The math can look right while the meaning is wrong.
UpScore starts with your business. It looks across the revenue process using the same rules each time, identifies where there may be room for improvement, estimates what that improvement could be worth, and lets you follow the numbers behind it.
When you ask AI directly, it starts with your question. UpScore starts with your business.
One Video. One Monthly Review.
Watch one UpScore review from start to finish. See where revenue has been, where it’s headed, where the opportunities are, and what may need to change to move up.
“How’s the business doing?”
“Here’s where we should look first.”
The Proof
Hear directly from a ServiceTitan contractor putting this approach to work.
Elmer Zubiate
Find It. Work It. See If You Moved Up.
Each month, review the business, choose an opportunity worth working on, understand what could move it, then come back and see what changed.
See
Where has revenue been, and where is it headed?
Find
Where is there room to move up?
Compare
What could each opportunity be worth?
Understand
What numbers may need to change?
Measure
Did we move up?
Your team does the work between reviews. Next month, UpScore shows you what moved and where the next opportunity may be.
A Year of Moving Up
One UpScore shows you where the business stands today. A year of UpScores shows you what changed.
You can see which areas improved, how the revenue outlook changed, and where the next opportunity may be. Instead of trying to fix everything at once, you keep finding the next place worth working on.
Larger companies can pay analysts to dig through business data looking for opportunities. UpScore gives ServiceTitan contractors a monthly way to find where to focus without adding an analyst to the payroll.
See What Your ServiceTitan Data Has Been Trying to Tell You
The data is already there. The hard part is knowing what deserves your attention.
UpScore brings it together in one Monthly Revenue Progress Report so you can see where you stand, where the opportunities are, what they could be worth, and what may need to change.
Save $768
14-Day Full Refund Guarantee
Use your first UpScore to see your own numbers and opportunities. If it doesn’t earn a place in how you run the business, cancel within 14 days for a full refund.
You decide after you’ve seen your own numbers.
Questions Smart Owners Ask Before Getting Their UpScore
What is UpScore?
It’s your business’s monthly scoreboard. Using your ServiceTitan data, we grade (A–F) each stage of your revenue process so you can see what’s working and where opportunities are being missed.
What parts of my business are graded?
Every step from the first phone call to the final invoice: Marketing Leads, Lead Classification, Booking, Dispatch, Opportunity to Sell, Conversion, Revenue Quality, and Revenue Trend.
How are the grades decided?
We don’t measure effort; we measure outcomes. The grades reflect what actually happened in your business, giving you an honest and consistent picture of performance.
Why might my grade feel lower than expected?
That’s common. A lower grade isn’t a criticism; it highlights where improvements can make the most significant difference to revenue.
How often do I get a report?
Every month, usually about five days after the month closes, once your ServiceTitan data has settled.
How quickly will I see my first report?
Within two business days after you connect your ServiceTitan account.
Do I need technical skills?
Nope. The setup is simple, and the report card is written in plain language that anyone on your team can understand.
How do I receive my report?
You’ll get a secure link you can open in your browser.
What should I do with the results?
Think of the report like a coach’s feedback. It shows where you’re strong, where you’re losing ground, and how much more revenue you could capture by making targeted improvements.
Is my information private?
We respect your privacy. We will not sell it or distribute it. You can read our privacy policy here.
See Where You Stand. Find Where to Move Up.
UpScore, Your Monthly Revenue Progress Report
$83 a month. $996 launch price for your first year. 14-day full-refund guarantee.